Traffic clock
project description
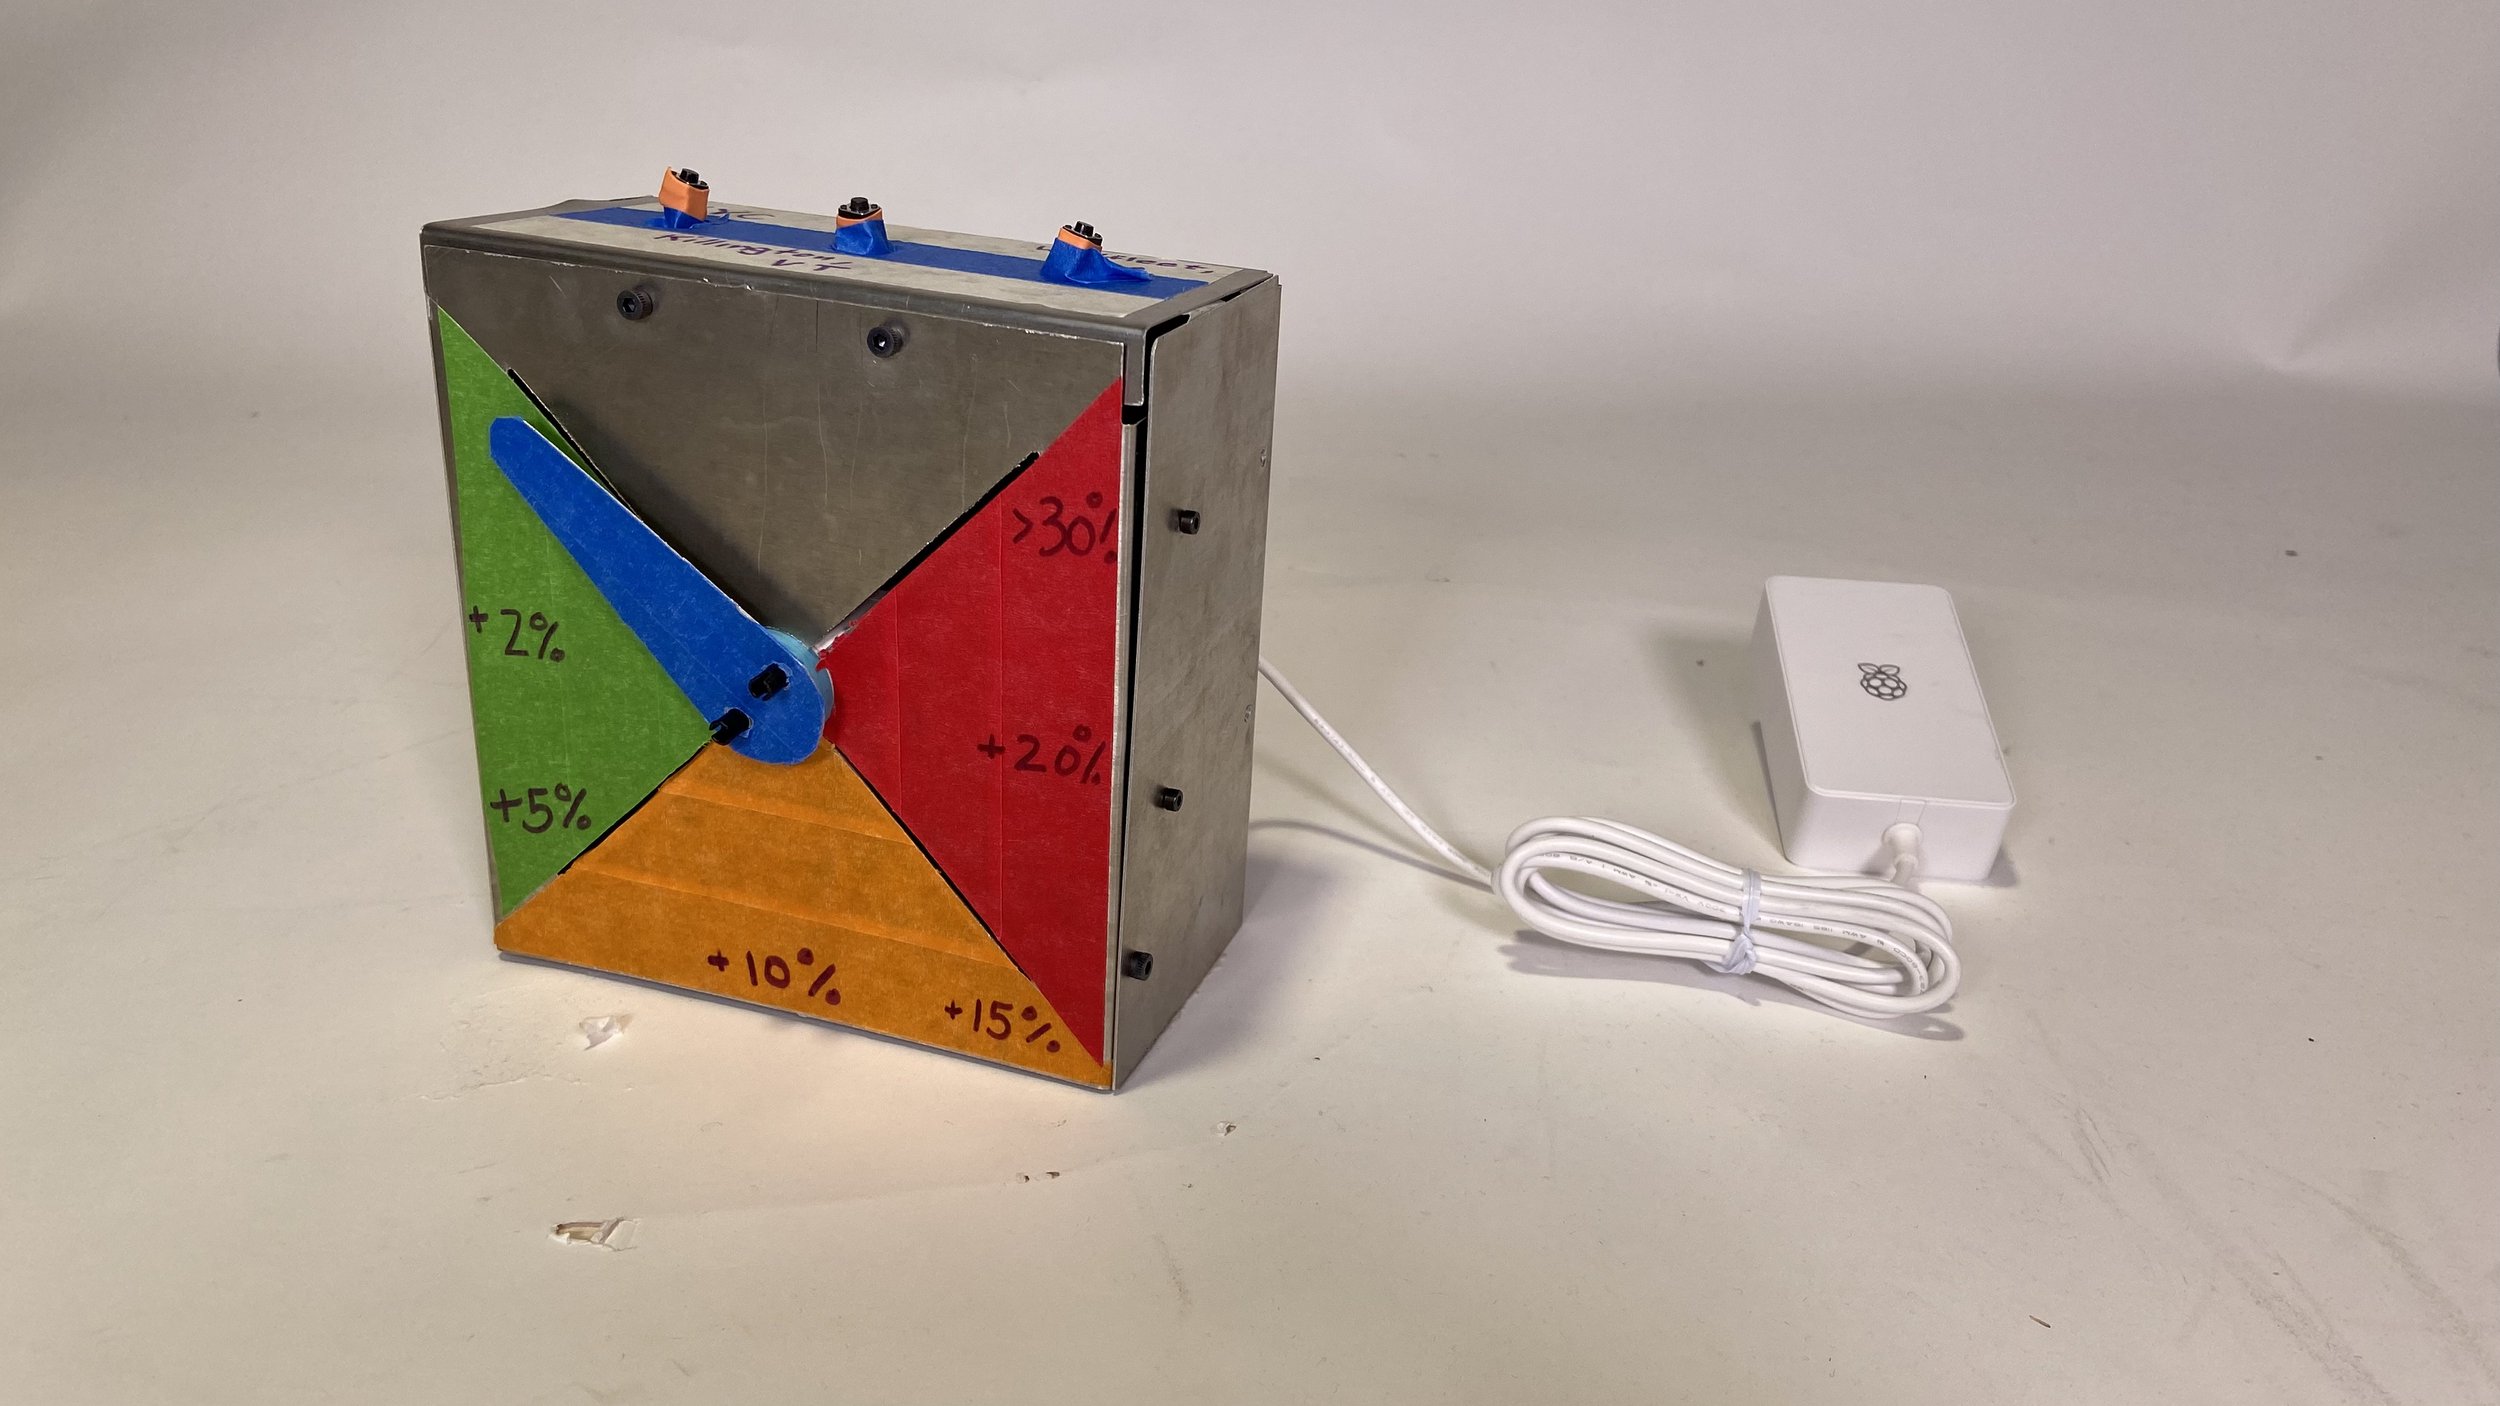
For a project in my ME35: Robotics class, I was tasked with building a “clock-like” data dashboard that displayed data from an API. I decided to build a “traffic clock” that would display the additional driving time (in % of original trip length) to a location by using the Google Maps API. A user could press one of three buttons on the top of the clock, which corresponded to three locations. Traffic would then be computed from Tufts to that location and displayed on the front of the box.
I decided to make this challenge a bit harder for myself, by making the box out of sheet metal. I wanted to get more comfortable making parts out of water-jetted aluminum by leveraging OnShape’s sheet metal manufacturing tools. The result was a clean and functional sheet metal box that enclosed all of the electronics.
The software is relatively simple and is documented on my GitHub. It consists of 3 scripts:
maps_api.py returns the driving time with and without traffic between two locations. It takes Plus-codes as input and outputs driving time as timedelta objectscontrol_clock.py maps the increase in driving time from a percentage to a motor angle. This mapping is intentionally nonlinear to make the display more informative. It also reads the buttons and writes motor movements.main.py accepts runtime arguments and runs the mainloop.
The clock worked really well, and the code is modular enough to be used in future projects!

All of the electronics are integrated into the metal box, the only input is power.

The clock in action. There was ~1% traffic to Killington and no traffic to Wellfleet.